
How I got into programming
In today’s world, advances in technology and laboratory methods make the handling of ever-increasing amounts of data in science very important. For handling large amounts of data, computer science skills are more in demand than ever. Therefore, scientists, students, postgraduates, etc. are beginning to get more involved with programming languages.
As a medical student, I am now for the first time dealing with such large amounts of data during my doctoral thesis at the Institute of Human Genetics. Due to the possibilities offered by new sequencing technologies and large sample groups, big data analysis plays a major role in Human Genetics. Since my project for the doctoral thesis mainly included data evaluation and statistical work, I started to learn the programming language R to be able to carry out these analyses.
Starting a programming language, the initial enthusiasm, the first setbacks and the almost giving up
I started my first online course last year in May and enjoyed learning R right from the start. My doctoral thesis motivated me to sit down at my desk in the morning and to start with the programming exercises. In my opinion, it is a great advantage that the courses on the internet combine learning content in the form of videos and texts with subsequent exercises to apply and train the new knowledge. In this way, you can see what content needs to be repeated and you stay motivated to continue with the next chapter.

After my first few days of learning, it was already time to start with the analysis of genomic data for my project. However, after the successes in the online course, you realize that if you switch to your own data set, you will face completely new problems, because in contrast to the course-exercises, the questions are not based on content already discussed.
Especially very small things suddenly become such a difficulty: You can spend a long time at the axis labeling of a single graph! Having encountered many such small problems and solving only a few, I was really frustrated at some point and not so motivated anymore.
Also, with large amounts of data in your project, individual calculations can take a very long time. I still remember very well how I started a script for Christmas and then had to wait anxiously for the result after 2 weeks, not knowing whether it would break off somewhere in the middle.
It is still particularly difficult for me to understand scripts written by others. But if I go through them step by step, it works much better and I can learn a lot from them and use them for my own analysis. Usually, after few months of coding, you will realize at some point that even your own scripts are not so easy to understand, so I always advise you to comment on every single step in the script!
Ray of hope (getting some results)

Even if not everything worked out as I imagined it, for me, learning a new piece of code or to work with a new R-integrated package was a great sense of achievement every time. The tasks that don’t work out directly also have the attraction that you have to puzzle around. The small successes encouraged me to always try the next task and especially the support of the other PhD students helped me very much during this time.
The huge online community of other beginners is also a great help. There are many websites with explanations if you get stuck, because many questions have already been asked by others before you, so there is already a question-answer catalog. You quickly become a professional “Googler” for commands in R 😉
Advantages & Challenges
In my opinion, a big advantage of working with data compared to laboratory work is the possibility to save the experiment in between and that a certain step of the experiment doesn’t have to be completed on that day.
I also think it’s great that you can use your free time without the internet for programming, and of course, practicing a programming language is very suitable for home office during the Corona pandemic, too. Although you can write codes from anywhere, for me it was a help to drive to the university hospital to work on the computer, because I was less distracted there and it was easier for me to separate work from my free time in the evening.

A challenge while working with R is that tricky small tasks can sometimes tempt you, especially in the beginning, to use another program: Changing the size of the title on a graph means clicking on a single button in PowerPoint why it’s, at least for me, challenging to stick with R in these cases. Nevertheless, it is worth learning how to do data analysis and charting in R in the long run, because many large amounts of data become unclear and can no longer be handled with programs like Excel.
Advise for beginners
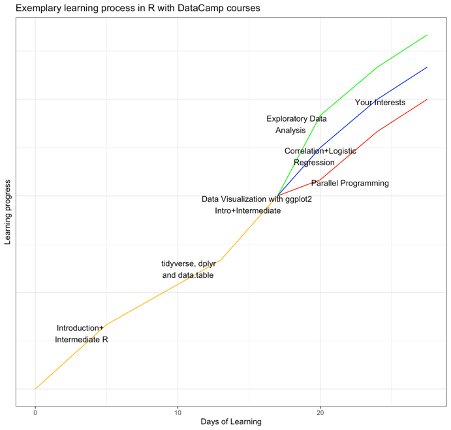
To start learning a programming language, the best way for me was to take an online course. There are several sites like DataCamp or edX, which offer many cheap or even free courses and you can, of course, find many free educational videos on YouTube. There are articles evaluating these options to help you choose the right one before you start. I started with the Introduction courses for R in DataCamp. Afterward, I took courses on the basics of the packages dplyr, tidyR, and data visualization with ggplot2. The first graphs are learned in a short time with the ggplot2 course. I consider all these courses as basic courses to learn R which will give you a first insight. Currently, I am working with edX where videos and texts are combined with integrated exercises from DataCamp for training, which I can also highly recommend.
However, it is very important to start early enough with your own data set. Only then you will notice which courses are particularly relevant for you! Later on, you can prepare yourself for special topics/data analysis with more advanced courses.
I especially recommend working directly with RStudio (a desktop version with great features), because I think it makes getting started much easier.
I have only told you here about my experience with R. When it comes to software for data evaluation only, you are already spoilt for choice between R, Python, MATLAB, SPSS, and many others. I chose R because everyone in our working group works with this software and my supervisor recommended me to work with R. Since R is an open-source language, there is an extremely large community, as I already mentioned. This leads to a large number of implementable packages which include many functions for great graphs and advanced statistical language, which are also free.
As you can see, I have become a big fan of R and I hope that I can use R in the next years too. Maybe I can inspire some of you to use R or another programming language in the future!
Author: Hanna Zieger